Using RNA Sequencing to Investigate Cerebral Gene Expression in Cactus Mice
One of the most basic rules of life on Earth is that water is necessary for survival. In water-scarce locations such as the desert, many animals, such as the camel and iguana, have developed adaptations such as long-term water storage or obtaining water exclusively from food (He et al., 2023). The biological mechanisms driving these adaptations are not widely understood, and their investigation has broad implications for conservation and biomedical research, especially as global desertification increases because of climate change (Burrell et al. 2020). Understanding these mechanisms may help scientists predict which species are in the most danger from widespread water loss or develop treatments for water deprivation in more susceptible species, including humans.
The cactus mouse—Peromyscus eremicus—is one of the most striking examples of a desert-adapted species, because it is able to survive its whole life (about a year) without drinking water or urinating, though it will drink if water is presented to it. In most animals, this water deprivation would result in long-term organ damage and/or death, but the cactus mouse is able to maintain full functionality (MacManes and Eisen, 2014). Native to deserts in southwestern North America (Macmillen, 1965), the cactus mouse is the focus of Dr. Matthew MacManes’ genomics and physiology lab at the University of New Hampshire (UNH).
I have been working with Dr. MacManes to research the cactus mouse since receiving a Research Experience and Apprenticeship Program (REAP) grant from the Hamel Center for Undergraduate Research in 2022. My previous projects have ranged from aiding graduate students in observing spatially patterned gene expression in the cactus mouse kidney to assisting in a study on the hypothalamus and pituitary gland, two neurological structures involved in hormone synthesis. Our ultimate goal in the lab is to determine the methods by which the cactus mouse can survive such long stretches without water, and as such, we attempt to characterize the physiologic, genomic (DNA), and transcriptomic (RNA) changes undergone by this rodent during periods of dehydration.
When you think about organs involved with fluid retention and processing, the kidney is one of the first things to come to mind, because it is involved with blood filtration and urine production. The gastrointestinal tract is another strong candidate, because it absorbs all the liquid that we drink and that is present in the food we eat. But like virtually all biological processes, all arms of the mammalian fluid retention and dehydration responses are spearheaded by the brain.
During dehydration, blood volume and pressure decrease because of the decrease in present water, which can result in organ damage if left unmanaged. In response to this, multiple regions of the brain, like the hypothalamus, become involved with releasing signals that cause hormone and neurotransmitter synthesis. These compounds constrict blood vessels, increasing blood pressure to a level closer to normal. Additionally, they lead the kidneys to reabsorb water and stimulate thirst receptors to prompt the animal to intake water, both of which help re-increase blood volume (Thornton, 2010). This process is known as osmoregulation, and analyzing the brain in the context of osmoregulation and fluid retention can provide crucial information about the dehydration response by addressing its root instigator.
For my Honors senior thesis, the first project I have designed myself, I am examining how gene expression in five different regions of the cactus mouse brain is impacted by dehydration. I aim to accomplish this by creating RNA sequencing libraries, or representations of the genes in use, for each brain region in two groups of mice—one that had free access to water and one from which water had been withheld—and using bioinformatic data analysis to highlight differences between the five regions and two groups. My love for neurological research was sparked by the aforementioned neuroendocrinology study in the lab. The mammalian brain is in control of virtually every process in the body, but much is still unknown about its function and the detrimental effects of its malfunction. I was thrilled to be awarded a Summer Undergraduate Research Fellowship (SURF) grant from the Hamel Center to support the first phase of this research.
Background
An organism’s genome, or its full set of genetic material, stores important biological information that serves as the instruction manual for the organism’s survival and growth via protein synthesis. The genome is made of DNA, which is itself made of two strands of molecules known as nucleotides. In plants, animals, and fungi, the genome is enclosed in a nuclear membrane and unable to move freely to other parts of the cell. This means that an intermediate molecule, mRNA, is needed to transmit the instructions for protein creation encoded by DNA to the rest of the cell. When induced by outside stimuli in the cell, certain enzymes will induce mRNA transcription from a section of DNA known as a gene. Unlike double-stranded DNA, mRNA is smaller and single-stranded, allowing it to exit the nucleus and have its nucleotide sequence used as a template to build proteins throughout the cell.
In animals, the full genome contains tens of thousands of genes, the vast majority of which can be transcribed into an mRNA and thereafter translated into a gene product such as a protein (Cooper, 2000). However, not every protein is needed for each organ or structure’s individual function—think about the differences between your heart and brain, for example. Because of this difference in function, in a given cell, only a handful of genes are transcribed into mRNA. Even when the same gene is needed in two cells, it may be transcribed, or expressed, at a different frequency in one cell than in the other, depending on the cell’s location and functions. (If many copies of a protein are needed to fuel certain biological processes in a given cell, many copies of mRNA molecules are made from the original gene.) This variation in gene concentration is known as gene expression.
When characterizing the gene expression in a cell or tissue, it is most helpful to observe the mRNA present, rather than the DNA, because it will directly correlate to the genes expressed there. However, genomic nucleotide sequences are traditionally recorded in DNA, so to study gene expression, mRNA needs to be reverse engineered back to DNA. This process, transcriptomics, consists of extracting the mRNA in a tissue sample, converting it to DNA to be sequenced, and using computational analysis to determine which genes are operational in that tissue.
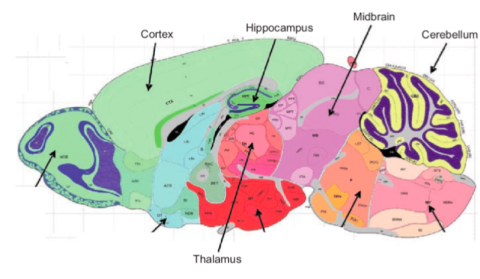
Figure 1: Cross-section of mouse brain with relevant structures labeled (Heydel et al., 2010)
Even within tissues, there can be large amounts of differentiation in gene expression. The brain is one such highly differentiated tissue—consider the amount the brain has to do and control, from sleep to movement to memory—with clearly delineated regions and structures. If different genes, and therefore proteins, are expressed in different areas of the tissue, this could indicate that these different regions perform varied, and possibly unexplored, functions (Yue et al., 2023). By determining this variation within a tissue, the research community can gain a greater understanding of how the tissue functions and fits into the body as a whole, with benefits for both evolutionary and biomedical research.
Bulk RNA sequencing, the most efficient form of gene expression analysis, takes an average of all the gene expression occurring in the sample without taking into account the sample’s potential structural variation. To ensure structural variation within the mammalian brain was considered in my analysis, I separated out and individually examined five of the most critical regions of the brain: the cerebral cortex, where information processing occurs; the hippocampus, which serves as memory storage; the thalamus, which regulates neuronal signaling; the midbrain, which controls voluntary movement and some reflexes; and the cerebellum, part of the hindbrain, which maintains motor function and other vital functions like breathing (National Institute of Neurological Disorders and Stroke, 2024). (Figure 1)
Methods
This project consisted of two phases: a “benchwork” phase, where I collected the required tissue samples and used bulk RNA sequencing to generate transcriptomic libraries, or digital representations of all of the expressed mRNA, for each sample; and an analysis phase, where I used bioinformatic data analysis techniques to look for patterns in gene expression across the samples.
Benchwork
My thesis project was originally designed to be completed via spatial transcriptomics, a gene sequencing technique that creates a map-like visual representation of the gene expression in a slice of tissue. However, because of external factors within the manufacturing company, the spatial platform I planned to use became inaccessible during the period I was collecting tissues (as detailed below). I was committed to maintaining the unexplored spatial element of my research question, so I chose to pivot to bulk RNA sequencing and dissect out the desired regions by hand.
To begin this project, I assigned my two hydration treatments, with an equal number of mice of each sex. Six mice from the MacManes colony in UNH’s Animal Resources Office were given water freely, and an additional six mice had water withheld for seventy-two hours. Previous experiments in the MacManes lab have demonstrated that after seventy-two hours, the immediate impacts of water deprivation, such as weight loss, plateau; therefore this time frame is used as our standard for dehydration trials. I am listed on the MacManes’s lab’s approved Institutional Animal Care and Use Committee protocol (#210602), which includes approval for dehydration and transcriptomic studies. At the end of the seventy-two-hour period, all brain samples were collected.
Across these twelve mice, I then collected sixty regions—the five listed above from each mouse—using a modified version of the 2024 MethodsX protocol for house mouse brain dissection (Aboghazleh et al., 2024). The cactus mouse brain is about the size of a walnut, so I needed to use a dissecting microscope and very small tools to dissect out each brain region with the most precision possible. I was fortunate to have the assistance of Disha Hegde, another undergraduate in the lab, for this part of the process. Each dissected tissue sample was stored in RNAlater stabilization solution to prevent the fragile RNA from degrading before it could be sequenced.
Following dissection, the tissue samples were sent to the Hubbard Center for Genome Studies, next door to our lab, for the RNA sequencing steps of this project. Once the RNA was extracted from the tissues, converted to complementary DNA (cDNA), a necessary step for the sequencing process, and sequenced, the sequences were returned to me for data analysis.
Data Analysis
Once I received the data files containing cDNA sequences, I used UNH’s high-throughput computing server, Premise, for three primary functions. First, it converted the sequencing files to a format readable by my data analysis platform. Second, it aligned each cDNA sequence to its corresponding location, or gene, on the known cactus mouse genome; this was accomplished by scanning the genome for the nucleotide sequence that most closely matched the cDNA sequence, as seen in Figure 2.
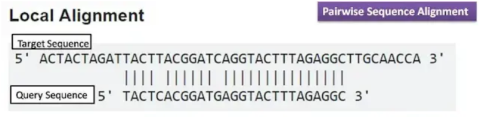
Figure 2: Example of cDNA (“Query”) sequence alignment to genome (Major Differences, 2016). Premise does not use the “Local Alignment” method, but the processes are very similar.
Finally, Premise counted the number of sequences mapped to each gene and, if they were only part of a gene instead of a whole gene, determined their exact location within the gene. These “counts” indicate the level of expression of each gene in each sample, with more counts indicating higher expression of that gene, and are critical for observing the different levels of expression across variables—hydration treatments, regions, or sexes. As a high-throughput server, Premise uses a large network of computers to run a large number of coding jobs efficiently.
I then uploaded these counts to v. 4.4.1 of the R statistical analysis platform and performed further bioinformatic analyses in R Studio to observe the differences in gene expression between the hydration treatments, brain regions, and sexes (R Core Team, 2024; Love et al., 2014; Wickham, 2016; Kolberg et al., 2023). These analyses included differential gene expression (DE) plots of each region to determine the regions for which dehydration had the greatest impact on gene expression; a principal component analysis (PCA) to determine which variable had the greatest impact on gene expression; and gene ontology (GO) term analyses of genes in each region and treatment (e.g., hydrated midbrain or dehydrated hippocampus), which categorize expressed genes by the cellular locations or functions to which they relate.
Preliminary Results and Discussion
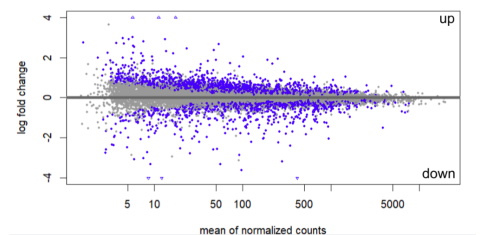
Figure 3: Pooled differential gene expression (DE) in all five brain regions in the dehydrated treatment vs. the hydrated treatment. Each dot represents one gene, while blue dots represent genes that are significantly differentially expressed. Genes with positive y-values (up) are expressed more in the dehydrated treatment, while genes with negative y-values (down) are expressed more in the hydrated treatment.
Initial DE analysis of the five regions suggest that on the whole, more genes are differentially expressed in the dehydrated treatment than the hydrated treatment. (Figure 3) Individual DE analyses of each region indicate that the cerebellum experiences the greatest difference in gene expression when water is withheld, while the thalamus experiences the least variation between the two hydration treatments.
My initial research into the roles of various brain regions in the dehydration response indicated that the thalamus may have a significant impact because of its proximity to the hypothalamus, the region of the brain that directly controls osmoregulation. This meant I was somewhat surprised to see that not much differential gene expression appears to be occurring in this region when under dehydrative stress. However, I needed to remove two thalamus samples from the dataset simply because Premise indicated there were not enough counts to make them valid data points, which may have contributed to the low differential expression seen here. Because the brain is such a differentiated tissue, even within individual regions, it is also possible that various areas of the thalamus were performing opposite functions at the same time (for a possible example, blood vessel constriction and dilation), leading to a “canceling out” effect on the differential expression.
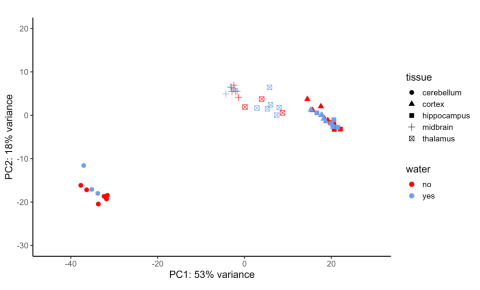
Figure 4: Principal component analysis (PCA) of the cerebellum, cortex, hippocampus, midbrain, and thalamus of P. eremicus. The x-axis is labeled with the proportion of differential gene expression explained by brain region, while the y-axis is labeled with the proportion of differential gene expression explained by hydration treatment.
The PCA plot, which was intended to analyze which variable had the greatest impact on gene expression, indicated that brain structure was the variable with the most impact, resulting in 53 percent of the recorded expression differences across the dataset. (Figure 4) This was to be expected simply because of how structurally and functionally different each brain region is from the others.
Samples coming from the same brain region tended to have similar gene expression; there was the most overlap between gene expression in the cortex and hippocampus, possibly because of their closeness to each other within the brain, which could suggest these two regions have similar or connected roles in the dehydration response. Hydration treatment had the second-greatest impact on gene expression, higher than sex, at 18 percent.
The most recent type of analysis I have completed on this data is called a GO term analysis, which groups the potentially hundreds or thousands of differentially expressed genes in a given brain region by the biological process or area in the cell they contribute to. This allows us to see a broader picture of what is happening in the brain during the dehydration response.

Figure 5: A sampling of biological processes occurring in various regions of the cactus mouse brain in the dehydrated treatment. The unannotated figure of the mouse brain was taken from the GENSAT Project at The Rockefeller University (Heintz et al., 2024).
On a large scale, genes highly expressed in brain regions in the dehydrated treatment were involved in expected functions such as hormonal signaling to aid with osmoregulation, cardiovascular changes to maintain a constant blood pressure and increase fluid retention, and metabolic changes, possibly to combat a phenomenon known as dehydration anorexia, where dehydrated organisms cut back on food intake (Blumstein and MacManes, 2023; Watts, 1998). (Figure 5) In contrast, genes highly expressed in brain regions in the hydrated treatment were involved in processes such as growth and development throughout various organ systems and increased mental function. (Figure 6)
Moving forward with this project, I plan to conduct a more in-depth analysis of the GO terms, including determining the biological reasons why each of these identified processes may be linked with their respective hydration treatments and brain regions. Ultimately, I hope this project is able to fill in some of the missing links between the brain and the mammalian dehydration response and shed light on some of the specific adaptations of the cactus mouse.
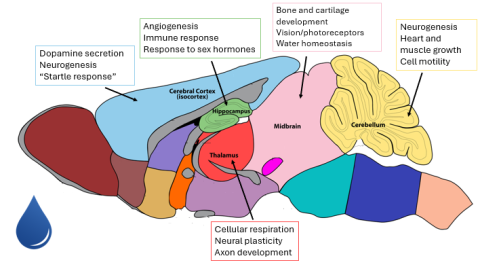
Figure 6: A sampling of biological processes occurring in various regions of the cactus mouse brain in the hydrated treatment. The unannotated figure of the mouse brain was taken from the GENSAT Project at The Rockefeller University (Heintz et al., 2024).
Future Directions
In the immediate future, another undergraduate in the lab plans to conduct a transcriptomic analysis of the cactus mouse brain stem; this data will be compared against mine to gain a more specified understanding of the spatial patterning of gene expression in the brain. Looking at the long term, Dr. MacManes recently submitted a grant proposal to the National Science Foundation that would fund a comparative study observing gene expression differences between seven different species of mice: six Peromyscus species, including two desert specialists, and Mus musculus as an outgroup or “control.” These cross-species comparisons will allow us to observe specific differences in molecular functions and physiology between species adapted to desert conditions and those that are not, further illuminating the unique characteristics that allow the cactus mouse to survive without water and opening the door to future evolutionary research across species.
I’d like to extend my gratitude to the members of the MacManes lab, past and present, with whom I have had the privilege to work over the past three years: Dr. Matthew MacManes, Disha Hegde, Cassidy O’Brien, Sahar Jamialahmadi, Dr. Dani Blumstein, Zahra Alim, Molly Kephart, and Sean Pierre-Louis. Their encouragement and insight have been critical to my development as a researcher. Thanks to the Hamel Center for Undergraduate Research, Mr. Dana Hamel, and the Patricia M. Flowers Scholarship Fund for their generous support of this project with a SURF grant, and the UNH Animal Resources Office for their care of our colony. The National Institutes of Health are not only a crucial supporter of our lab but a bastion for scientists across the country, and it is important now more than ever to acknowledge their contributions to global scientific progress.
References
Aboghazleh R, Boyajian SD, Atiyat A, Udwan M, Al-Helalat M, and Al-Rashaideh R. 2024. Rodent brain extraction and dissection: A comprehensive approach. MethodsX 12.
Blumstein DM, MacManes MD. 2023. When the tap runs dry: the physiological effects of acute experimental dehydration in Peromyscus eremicus. J Exp Biol 226(23).
Burrell AL, Evans JP, and De Kauwe MG. 2020. Anthropogenic climate change has driven over 5 million km2 of drylands towards desertification. Nat Commun 11.
Cooper GM. 2000. The Cell: A Molecular Approach. 2nd edition. Sunderland (MA): Sinauer Associates. 689 p.
He G, Zhang C, and Dong Z. 2023. Survival in desert: Extreme water adaptations and bioinspired structural designs. iScience 26(1).
Heintz N, Mamounas L, and Gerfen C. 2024. Section 09 (figure). The GENSAT Project at The Rockefeller University. https://www.gensat.org/imagenavigator.jsp?imageID=22880.
Heydel J, Holsztynska EJ, Legendre A, Thiebaud N, Artur Y, and Le Bon AM. 2010. Mouse brain regions (ABA) (figure). Drug Metab Rev 42(1): 74–97.
Kolberg L, Raudvere U, Kuzmin I, Adler P, Vilo J, and Peterson H. 2023. g: Profiler—interoperable web service for functional enrichment analysis and gene identifier mapping (2023 update). Nucleic Acids Res gkad 347.
Leib DE, Zimmerman CA, and Knight ZA. 2016. Thirst. Curr Biol 26(24).
Love M, Anders S, and Huber W. 2014. Differential analysis of count data—the DESeq2 package. Genome Biol 15(550): 10–1186.
MacManes MD, Eisen MB. 2014. Characterization of the transcriptome, nucleotide sequence polymorphism, and natural selection in the desert adapted mouse Peromyscus eremicus. PeerJ 12.
Macmillen RE. 1965. Aestivation in the cactus mouse, Peromyscus eremicus. Comp Biochem Physiol 16(2): 227–248.
Major Differences. 2016. Difference between Pairwise and Multiple Sequence Analysis (figure). Majordifferences.com. https://www.majordifferences.com/2016/05/difference-between-pairwise-an….
National Institute of Neurological Disorders and Stroke. 2024. Brain Basics: Know Your Brain. National Institutes of Health. https://www.ninds.nih.gov/health-information/public-education/brain-bas….
R Core Team. 2024. R: A Language and Environment for Statistical Computing. R Foundation for Statistical Computing, Vienna, Austria. https://www.R-project.org/.
Thornton SN. 2010. Thirst and hydration: Physiology and consequences of dysfunction. Physiol Behav 100(1): 15–21.
Watts AG. 1998. Dehydration-Associated Anorexia: Development and Rapid Reversal. Physiol Behav 65(4–5): 871–878.
Wickham H. 2016. Toolbox. In ggplot2: Elegant Graphics for Data Analysis. Springer, New York.
Yue L, Liu F, Hu J, Yang P, Wang Y, Dong J, Shu W, Huang X, and Wang S. 2023. A guidebookof spatial transcriptomic technologies, data resources and analysis approaches. Comput Struct Biotechnol J 21: 940–955.

Photo credit: Alexandra Hatch
Author and Mentor Bios
Sarah Nicholls is a biochemistry, molecular and cellular biology major originally from Exeter, New Hampshire. She is a member of the Hamel Honors and Scholars College as well as the Phi Sigma Biological Honor Society, graduating in spring 2025. Sarah’s honors thesis research on cactus mice in Dr. MacManes’s lab was partially funded by a Summer Undergraduate Research Fellowship (SURF) grant through the Hamel Center for Undergraduate Research. Her lifelong fascination with solving puzzles drew her to genomics research, which she sees as a process of decoding the secrets of life from a tiny molecule. The species of the cactus mouse, a mammal that does not need water to survive, seemed like the ultimate genomic puzzle to solve. In her three years in the MacManes lab, Sarah has gained both practical lab skills and the confidence to design and present her own projects. Through her experiences with Inquiry, including a previous article in 2023 and two years on the editorial board, she has also found a passion for science communication. In the fall, she is thrilled to be joining the 2025 cohort of Gates Cambridge Scholars, where she will begin a PhD in Medical Science at the University of Cambridge in England.
Dr. Matthew MacManes is a professor in the Department of Molecular, Cellular, and Biomedical Sciences, and Interim Vice Provost of Academic Affairs at UNH.
Copyright 2025 © Sarah Nicholls