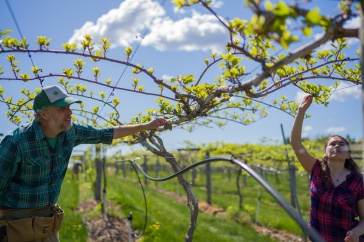


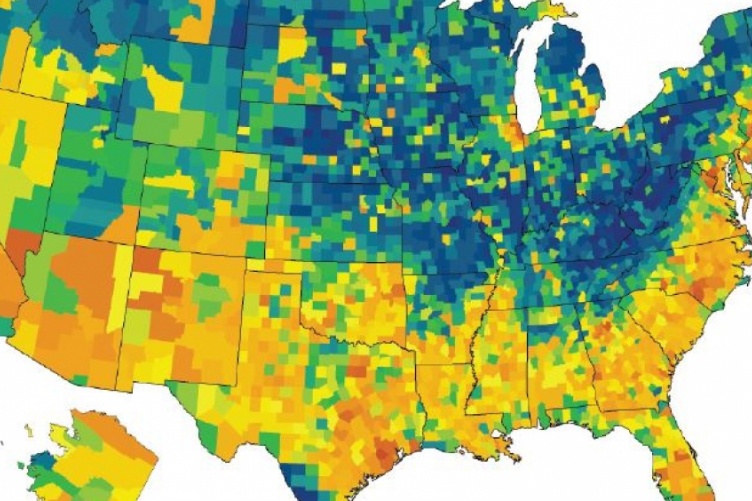
In much of the South and West, as well as in large urban areas nationwide, the population is quite diverse. This is reflected in the yellow and orange areas. Credit: UNH

60.1 percent non-Hispanic White; 18.5 percent Hispanic;
12.5 percent non-Hispanic Black; 5.8 percent non-Hispanic
Asian; 2.2 percent non-Hispanic of two or more races;
and .9 percent Native Peoples. Credit: UNH
In 2019, the U.S. population grew at the slowest rate in a century because of fewer births, more deaths, and less immigration. Yet even as fertility rates diminished regardless of race or Hispanic origin, and immigration declines were widespread, racial diversity continued to increase, according to a new analysis of U.S. Census Bureau data by the University of New Hampshire.
“This increasing diversity reflects two important demographic trends. The minority population is growing, and the non-Hispanic white population is declining. This interplay of white and minority demographic change increased diversity,” said Kenneth Johnson, senior demographer with the UNH Carsey School of Public Policy, whose research is supported by the New Hampshire Agricultural Experiment Station.
“In many areas of the country, diversity is widespread, but diversity is geographically uneven. In much of the South and West, as well as in large urban areas nationwide, the population is quite diverse,” Johnson said.
According to the demographer, the nation’s population increase, both last year and since 2010, is the result of minority population gains. The minority population grew by 1,777,000 or 1.4 percent in the last year and by 19,500,000 or 17.5 percent since 2010. A Hispanic population gain of 932,000 fueled 60 percent of the entire population increase last year. Non-Hispanic Asians and Blacks also made significant contributions to recent growth at 360,000 and 287,000, respectively. Both the multi-race (173,000) and Native peoples (24,400) populations grew as well.
In contrast, the non-Hispanic white population diminished by 225,000 between July of 2018 and July of 2019.
“The distinctly different demographic trajectories among non-Hispanic whites and minorities result from the interaction of several key demographic forces. Natural increase—births minus deaths—produced 62 percent of the modest U.S. population gain last year. Immigration remained important as well, producing the other 38 percent of last year’s population gain,” Johnson said.
“Though both natural increase and immigration have diminished over the past several years, they continue to contribute to the growing diversity of the U.S. population. The minority population is growing both because births far exceed deaths and because of modest immigration gains. In contrast, the non-Hispanic white population has diminished slightly because of reduced births, increased deaths, and minimal immigration,” he said.
According to Johnson, the driving force behind the growth of the minority population is natural increase. Currently, there are 2.9 minority births for every death. Among Hispanics, the ratio is even higher at 4.8 births per death. Minority births exceed deaths because the minority population—with the exception of Asians—is on average nearly ten years younger than the non-Hispanic white population, which has a median age 43.7, and because minority fertility rates are slightly higher, though they have diminished recently. Thus, minority populations include more women of childbearing age and fewer older adults at high risk of mortality.
Between 2018 and 2019, 70 percent of the minority population increase came from natural increase. Among Hispanics, natural increase was even higher accounting for 83
percent of the population increase. Thus, though immigration remains important, it is natural increase that is now producing most of the minority population gain.
In contrast, more non-Hispanic whites are dying than being born. For every 100 non-Hispanic white deaths last year, there were only 87 births. Between 2010 and 2019, there were just 94 births for every 100 deaths. Last year, whites accounted for 77 percent of all U.S. deaths, but 50 percent of births. The modest immigration of non-Hispanic whites is not sufficient to offset this natural decline resulting in a small population loss.
 In New Hampshire, demographic trends are similar to those elsewhere in the nation. New Hampshire’s population grew by 43,000 people between 2010 and 2019, according to recent Census Bureau estimates. Almost all of this population increase is the result of minority population gains. The minority population grew by 40,000, or 40 percent, since 2010.
A Hispanic population gain of 17,900 accounted for 41 percent of this increase and a non-Hispanic Asian gain of 11,200 for an additional 26 percent of the entire population gain since 2010 in the Granite State. The non-Hispanic Black population also grew by 6,200. Both the multi-race (4,500) and Native peoples (260) populations grew as well.
In contrast, the non-Hispanic white population grew by just 3,200 (.3 percent) between 2010 and 2019. In addition, more non-Hispanic whites died than were born in New Hampshire in each of the last three years, according to the National Center for Health Statistics, so almost all of the recent white gain was due to migration.
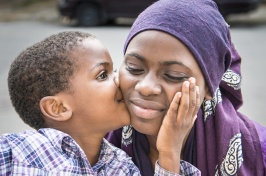
Children are in the vanguard of growing diversity both nationally and in New Hampshire, Johnson said. In 2019, just 50 percent of those under age 18 are non-Hispanic white. In contrast, 76 percent of the population over 65 is non-Hispanic white. Growing child diversity is fueled both by more minority children and by fewer non-Hispanic white children. Between 2010 and 2019, the minority child population grew by 6 percent, while the non-Hispanic white child population diminished by nearly 8 percent. In part, this is because there were just 1 percent more white women of prime childbearing age (20 to 39) in 2019 than in 2010, compared to nearly 17 percent more minority women.
“In addition, widespread declines in fertility rates reduced both non-Hispanic white and minority childbearing. These changes have made children the leading edge of an increasingly diverse society. Though the Great Recession and its economic aftermath diminished the number of births and fertility rates among all women, the U.S. population continued to grow modestly, and diversity increased. How the COVID-19 pandemic will influence future mortality, fertility, and immigration remains to be seen. While the pandemic may impact the rate of change in diversity, long-term demographic trends make it likely that U.S. diversity will continue to grow,” Johnson said.
This analysis is based on Census Bureau population estimates released on June 25, 2020. The classification of births and deaths by race in Census Bureau estimates differs from the procedures used by the National Center for Health Statistics (NCHS). Thus, there are differences in the number of births and deaths classified as non-Hispanic white by the two agencies NCHS data do not allow for multiple race births or deaths—all babies and deaths are classified to one race category. The Census Bureau allows for multiple race births and deaths. NCHS data consistently show more non-Hispanic white births than U.S. Census data. Thus, readers should exercise caution in the interpretation of these results and recognize that this analysis is indicative of current trends using the best data available at this time.
This material is based upon work supported by the NH Agricultural Experiment Station, through joint funding of the National Institute of Food and Agriculture, U.S. Department of Agriculture, under award number 1013434, and the state of New Hampshire. This research also was supported by the author’s Andrew Carnegie Fellowship. Barbara Cook of the Carsey School provided GIS support for this project. Additional information about this research can be found at https://carsey.unh.edu/publication/US-population-growth-slows-diversity-grows.
Founded in 1887, the NH Agricultural Experiment Station at the UNH College of Life Sciences and Agriculture is UNH’s original research center and an elemental component of New Hampshire's land-grant university heritage and mission. We steward federal and state funding, including support from the USDA National Institute of Food and Agriculture, to provide unbiased and objective research concerning diverse aspects of sustainable agriculture and foods, aquaculture, forest management, and related wildlife, natural resources and rural community topics. We maintain the Woodman and Kingman agronomy and horticultural research farms, the Macfarlane Research Greenhouses, the Fairchild Dairy Teaching and Research Center, and the Organic Dairy Research Farm. Additional properties also provide forage, forests and woodlands in direct support to research, teaching, and outreach.
The University of New Hampshire is a flagship research university that inspires innovation and transforms lives in our state, nation and world. More than 16,000 students from all 50 states and 71 countries engage with an award-winning faculty in top ranked programs in business, engineering, law, liberal arts and the sciences across more than 200 programs of study. UNH’s research portfolio includes partnerships with NASA, NOAA, NSF and NIH, receiving more than $100 million in competitive external funding every year to further explore and define the frontiers of land, sea and space.
-
Written By:
Lori Tyler Gula, Ph.D., '19 | NH Agricultural Experiment Station | lori.gula@unh.edu | 603-862-1452