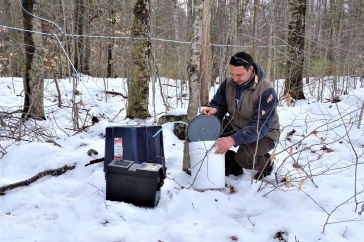


Researchers with the University of New Hampshire have been recognized by the U.S. Environmental Protection Agency for their innovative efforts in using low-cost technology to monitor water quality in manmade reservoirs.
Mapping the Value of Water Quality Improvements
COLSA professor maps water quality scenarios for use in innovative survey examining the economic value of water quality improvements
Tuesday, April 18, 2023
Key Finding:
Data from surveys paired with digital maps of water quality areas suggests that the willingness to pay (WTP) for water quality improvements by households extends beyond their home area or iconic locations to areas that have individualized connections. Previously, it was believed that households place higher value on water quality improvements made in their own neighborhoods or in iconic areas such as vacation destinations.
Willingness to Pay (WTP): The maximum price that a customer is willing to pay for a product or service.
It is traditionally assumed that the economic value of water quality improvements depends on where those improvements occur, with the belief that households will generally place higher value on water quality improvements made in their own neighborhoods or in iconic areas such as vacation destinations. However, UNH COLSA associate professor Wilfred Wollheim collaborated on a recently released study that paired water quality scenarios with interactive maps, finding that households also value water quality improvements outside their local areas and/or in iconic locations. This finding suggests that historic policymaking around water quality improvements doesn’t accurately account for the entire scope of locations at which households would support water quality improvements.
Wollheim, who is also a member of the Earth Systems Research Center at EOS, was a co-author on the study led by Clark University and also involving Virginia Tech and the consulting firm ICF International. Their findings were published in the Proceedings of the National Academy of Sciences. Wollheim contributed GIS maps showing water quality measures for the network of 95,800 miles of rivers and streams draining New England. The maps were based on models his team developed over the past two decades and showed different scenarios of water quality improvement that would result from better management of point and non-point pollution sources.
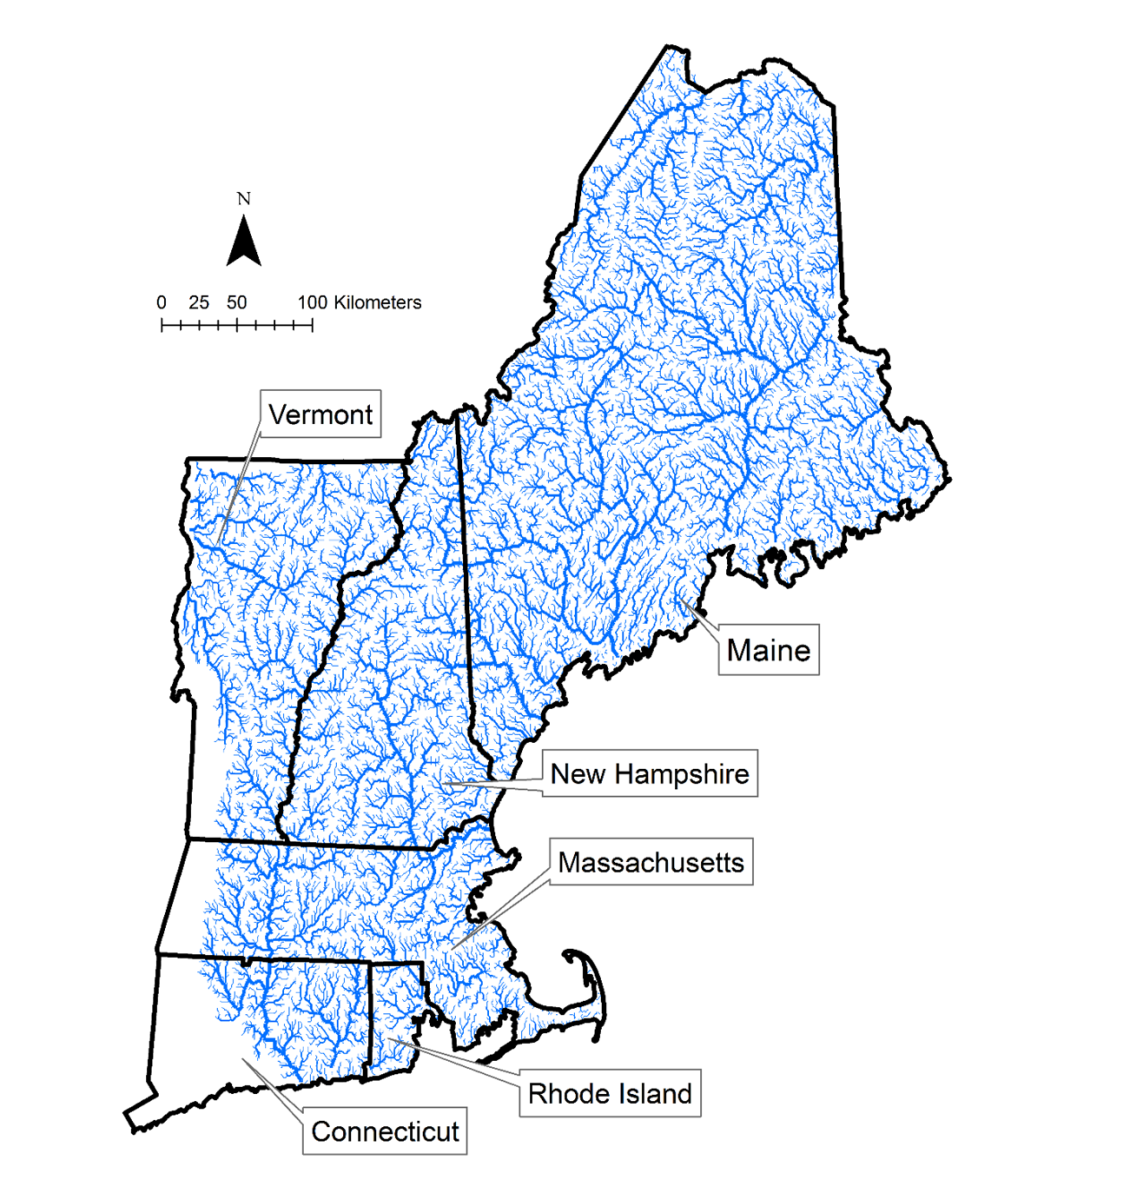
The maps were used in an online survey, which was distributed to households located across all six New England states. As part of the survey, participants could zoom and pan across the maps to see existing levels of water quality, different scenarios of potential improvements in water quality, and the type of improvements, such as to improve available drinking water and/or recreational opportunities. Survey takers then answered a hypothetical referendum question asking whether they’d support the different scenarios — at an annual cost to their household — and why or why not.
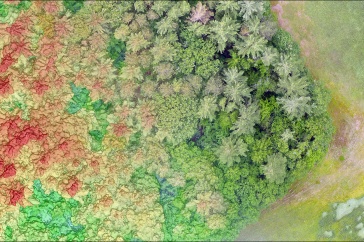
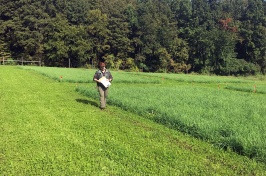
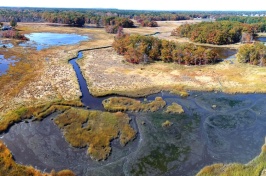
“The interactive maps show where water quality is poor for different types of surface water use, like for human use, for aquatic life, or water pollution in general,” describes Wollheim, co-director of UNH’s Water Analysis Group and a scientist with the New Hampshire Agricultural Experiment Station. Water quality generally tends to be poorer in more urban areas, like in and around Boston and Hartford, but also in southern New Hampshire, he added.
“We applied plausible management scenarios to create the maps, showing how extensive and where improvements could happen, and survey takers were asked how much they’d be willing to pay for the improvements.” said Wollheim. “It’s one of the first assessments of water quality value in the nation that covers an entire region, here in New England, and is based on realistic environmental conditions.”
Water Safety in New England Today

Percentage of rivers and streams in each water safety category (current condition)
A total of 1,698 people participated in the survey of New England water quality improvements, and 1,239 of the survey takers explored the digital water maps. The researchers found that when participants zoomed in to specific locations or panned across the maps, one third of the time the view included the person’s home area and, unsurprisingly, high values were placed on water quality improvements within 10-25 miles of their houses. The remainder of the time was spent investigating areas away from their homes — places that participants might vacation or recreate at or value for other reasons — and that they placed high values on water quality improvements to these areas as well.
“By basing this survey on realistic and regional water quality predictions, the results will ultimately help us to more effectively manage water quality improvements and understand what factors that New England residents of all different geolocations (urban, suburban and rural) and socioeconomic levels consider when supporting freshwater management policies,” added Wollheim.
This study was supported by a U.S. Environmental Protection Agency STAR Program grant. This work is co-authored by Robert J. Johnston, Klaus Moeltner, Seth Peery, Tom Ndebele, Zhenyu Yao, Stefano Crema, Wilfred M. Wollheim and Elena Besedin.
You can read the published article, Spatial Dimensions of Water Quality Value in New England River Networks, in the Proceedings of the National Academy of Sciences (PNAS).
-
Written By:
Nicholas Gosling '06 | COLSA/NH Agricultural Experiment Station | nicholas.gosling@unh.edu